REBORN UK

Fox Sports – Data visualisation.

Fox Sports

Summary.

Sport is changing. There’s a new breed of supporter who doesn’t just want to watch the game, they want to understand it. To give these fans a new perspective on the game, Fox Sports asked us to create data visualisations that were easy to understand yet powerful to comprehend.

REBORN were great to work with and took our data content to the next level, both visually and strategically. Not only were their design skills sharp, they managed projects across internal teams effectively to deliver high quality results.

Terry Quirk, Statistical Content Manager, Fox Sports

Project type.

Interactive data visualisation

Sector.

Sport

Services.

Strategy / Brand / Creative / User experience / Technology / Client support

Challenge.

Historically, Fox Sports’ data had only been popular with hardcore fanatics. The kind of supporter who could overlook its basic presentation for the insights that lay inside. But they wanted to open up their data to a much wider audience, making it a bigger part of the overall fan experience.

6558af345ddded1e9fab56953a30afe5fox_image_01_smallfox_image_02_small

Approach.

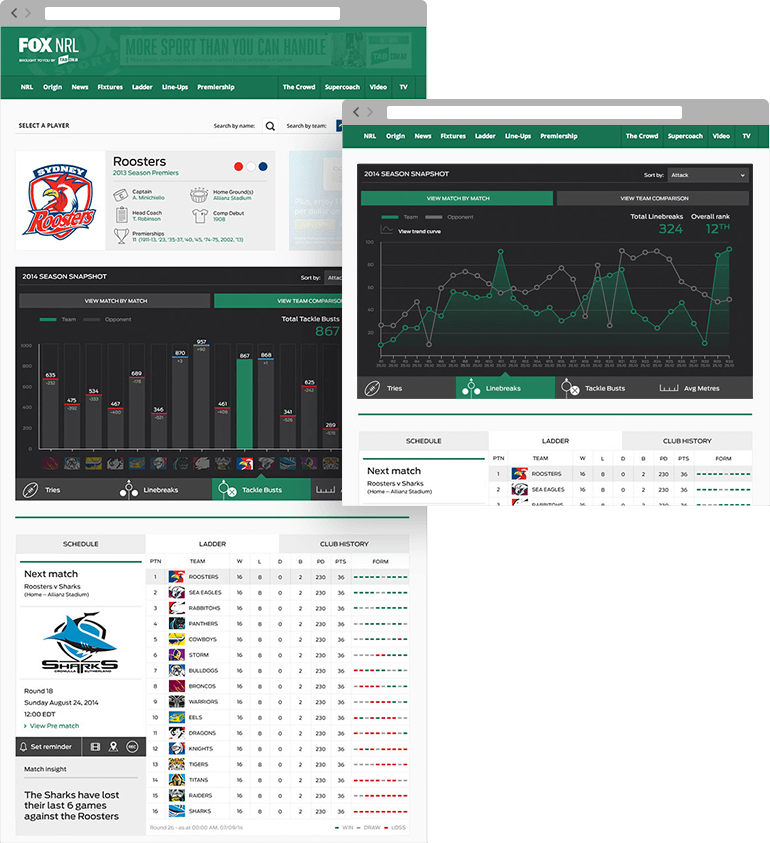
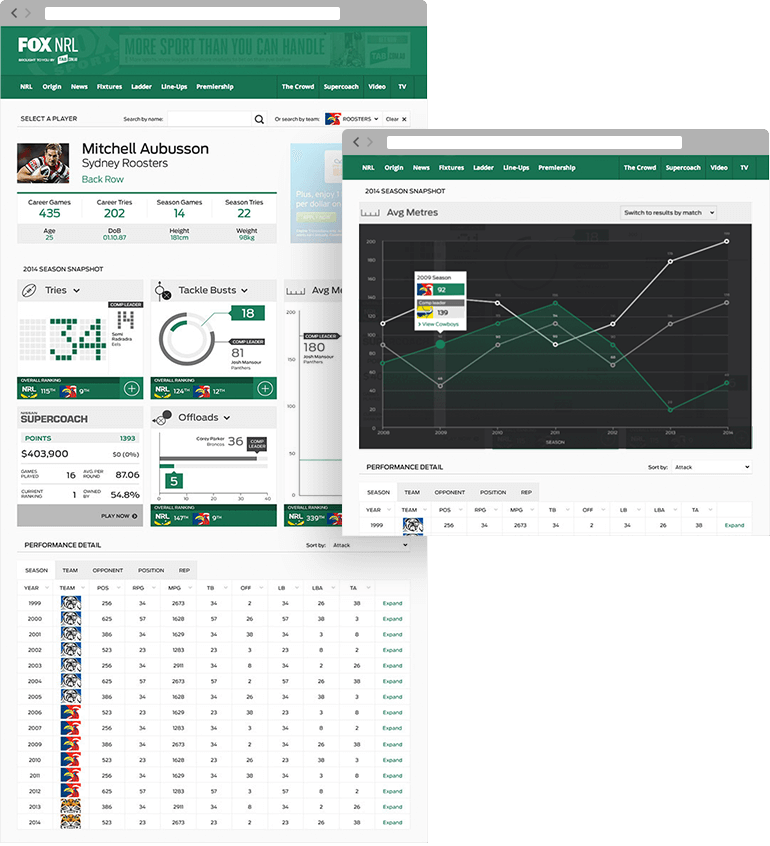
To unlock insights from data you need to break it down into chunks. So to help fans digest Fox Sport’s data, we broke it down into a library of simple-to-use widgets. Sourcing real-time data, each widget brought this information to life through beautifully animated icons, text and graphs. So whether people were viewing the data online or in a regular TV broadcast, they could instantly get a ‘read’ on the game.

fox_image_03_smallfox_image_04